Application Usage Visualization

How to Understand Application Usage in the Computer Activity Module  The Application Usage section in Cloudica™'s Computer Activity gives you a clear and visual way to see which applications and websites your team is using. It uses a treemap to show how often and how long apps are used, helping managers quickly spot trends and identify productivity patterns. What You’ll See in the Application Usage Treemap 63bd172d95fcaApplication Usage Visualization - Image 1.png The treemap is made up of tiles, and each tile represents an application or website. You’ll also see a heat map legend that uses colors to show how frequently an app was opened.  Here’s how to read it:
  • Tile Size The larger the tile, the more time users spent on that app. 
  • Tile Color Darker blue means the app was opened frequently. Lighter blue or gray means it was used less often. 
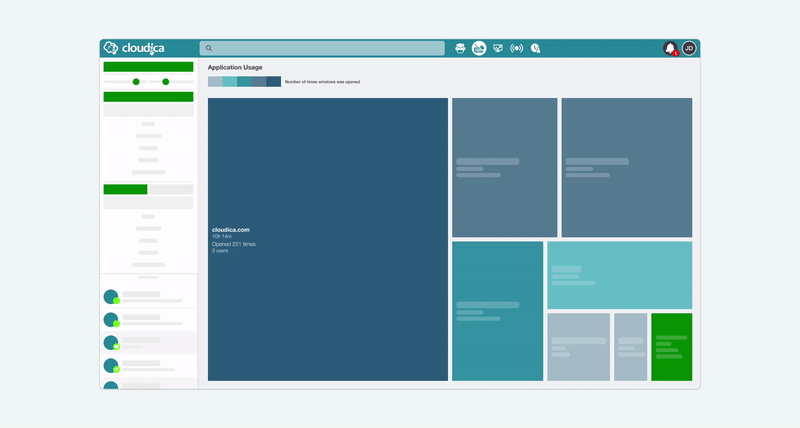
  • Green Tile This special tile groups together all apps that were used for less than one hour in total.
Information Shown on Each Tile Each treemap tile gives you these details at a glance:  63bd18f22b64cApplication Usage Visualization - Image 2.png
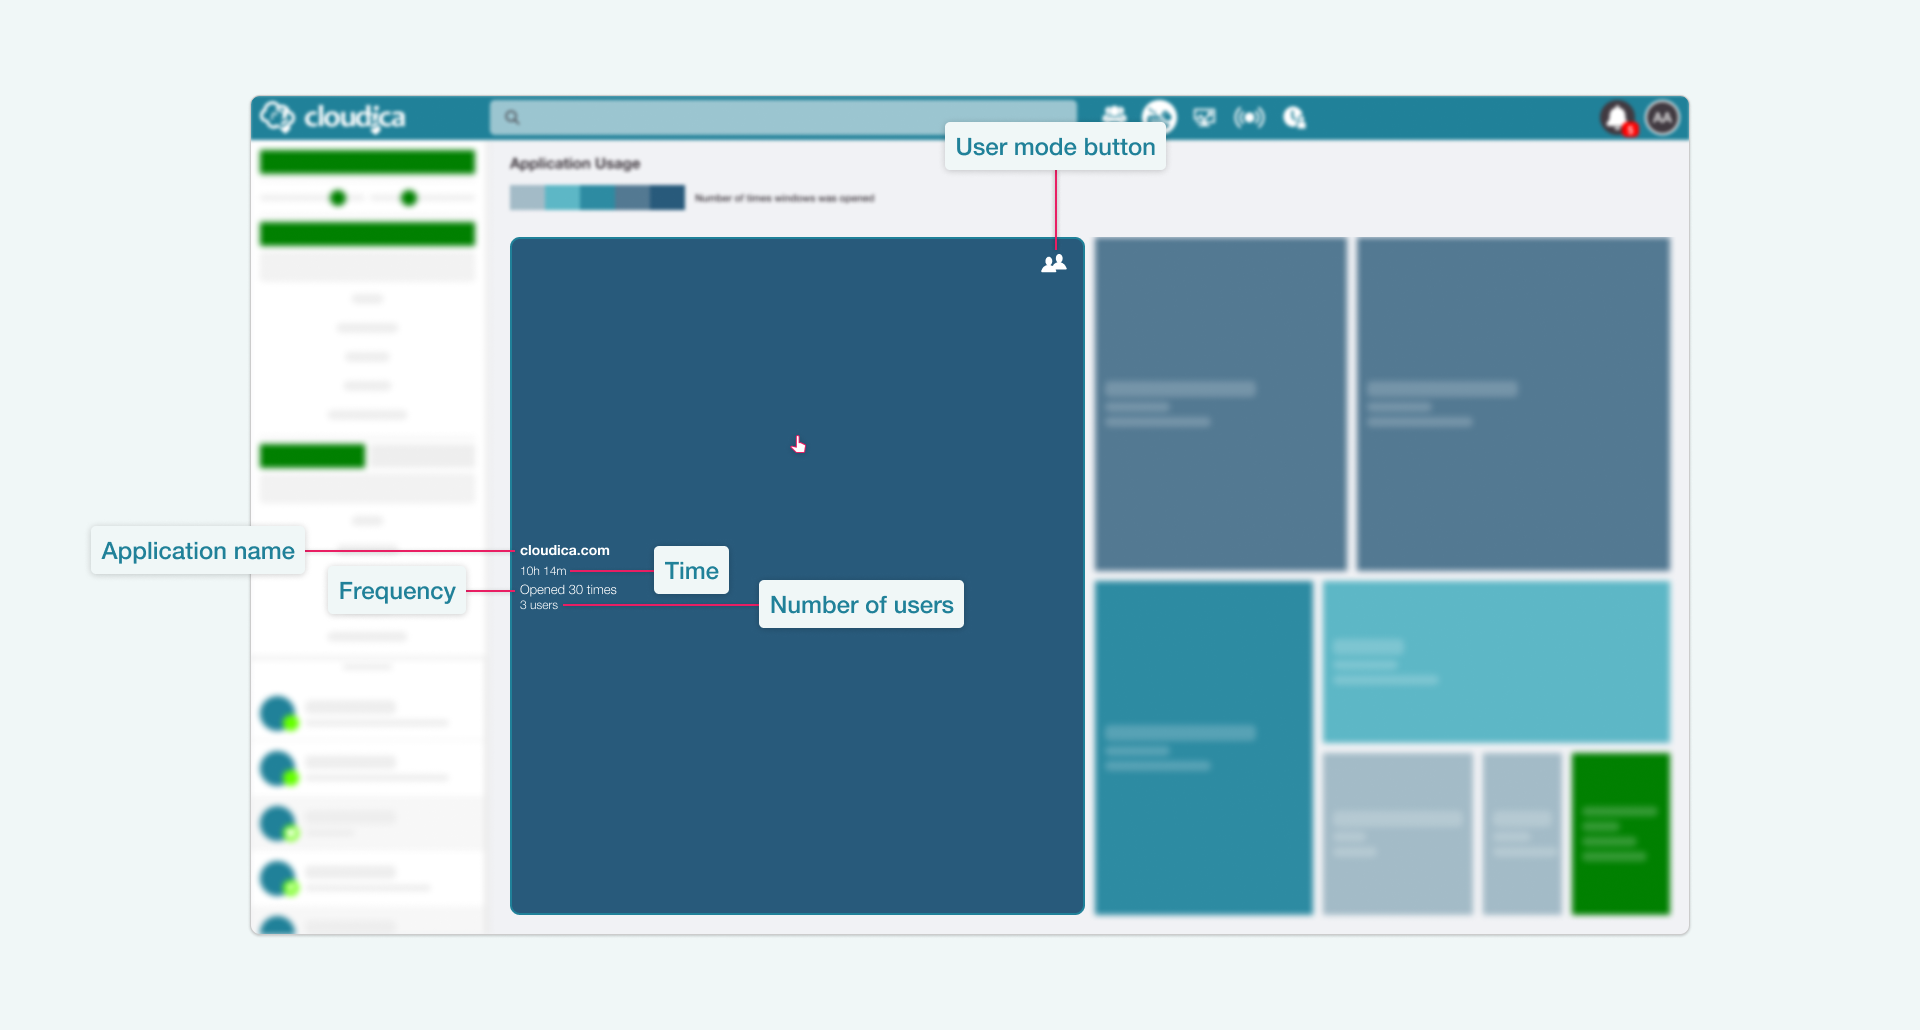
  • Application Name The name of the app or website. 
  • Total Time How long users spent using the app. 
  • Frequency How many times the app was opened. 
  • Number of Users How many team members used the app. 
  • User Mode Button Switches the view to show which users used this app.
Want to understand why tile colors change when using the timeline? Check out our guide: Using the Application Usage and Application Timeline Together  Switching Between Treemap Modes There are two ways to view the treemap
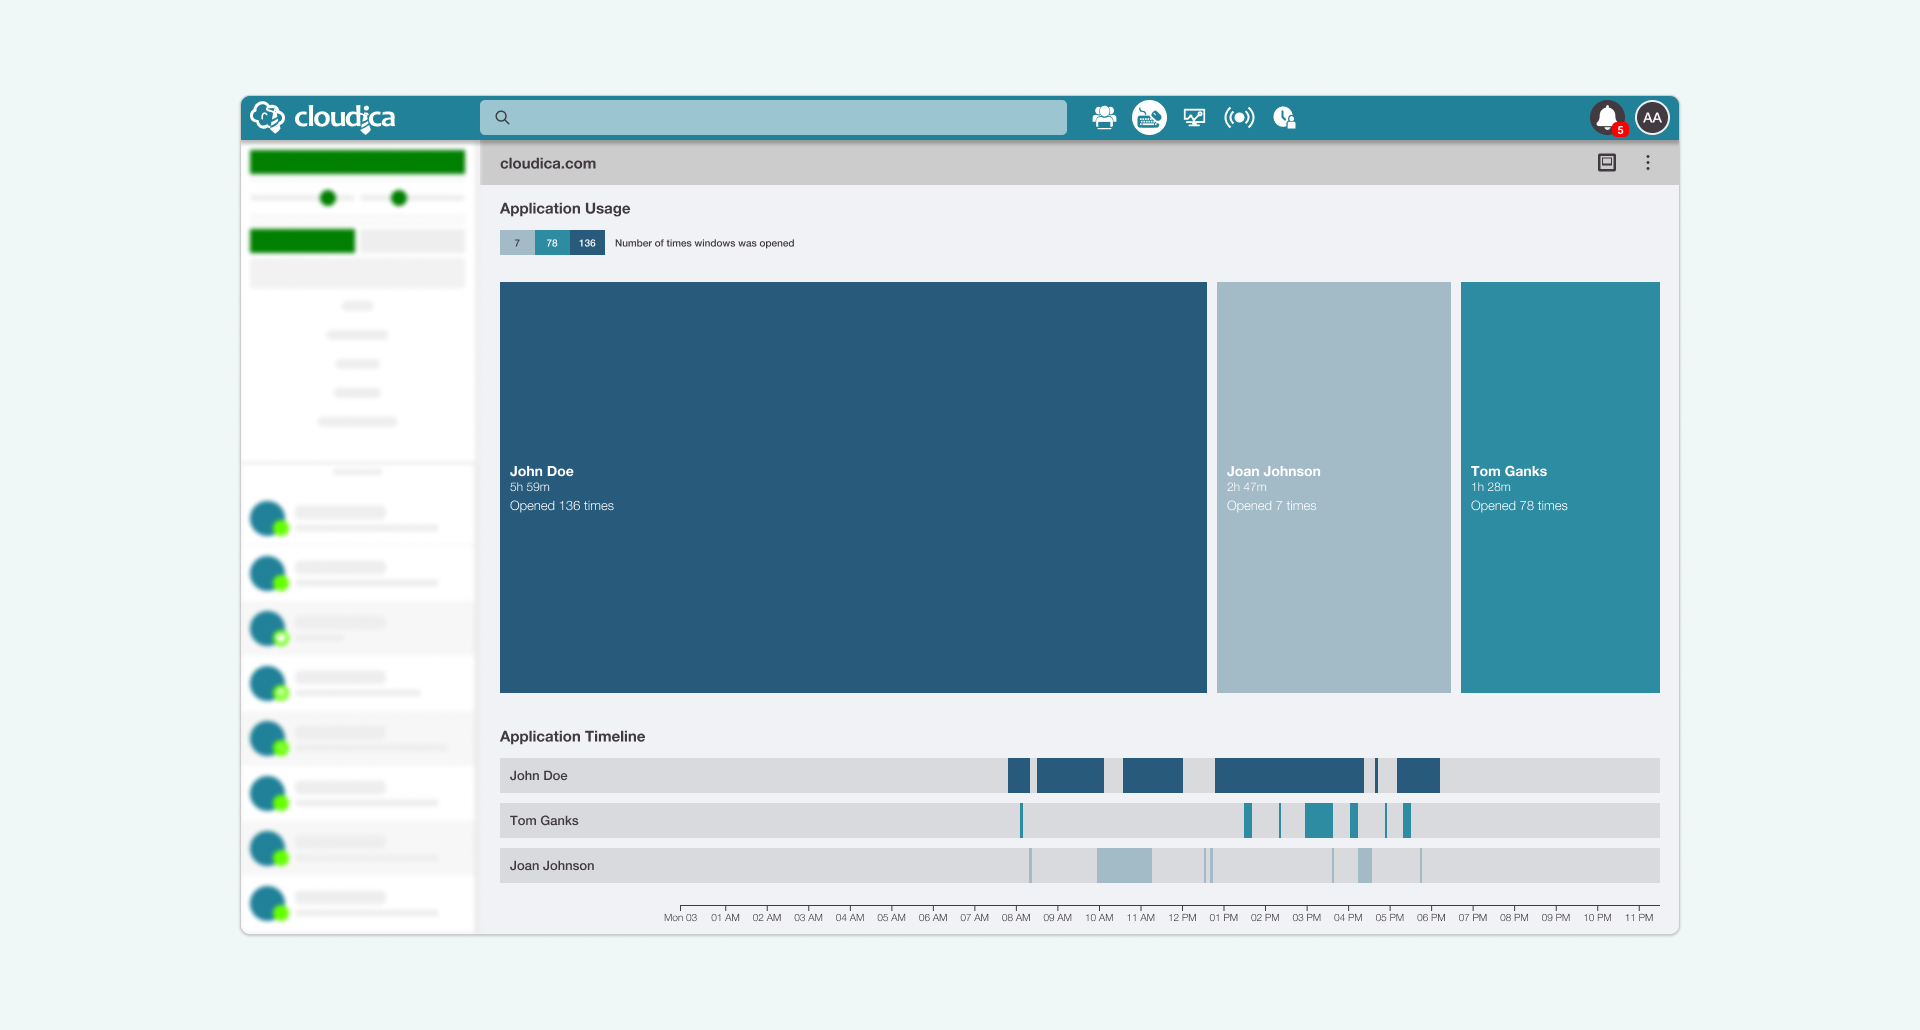
  • Application Mode (Default) Shows each app or website as a tile. 
  • User Mode Shows the team members who used a specific app. 
To view users for a specific application:  63bd1ac4910d9Application Usage Visualization - Image 3 gif_800px.gif
  • Click on the application tile to expand it. 
  • Click the User Mode button in the upper-right corner of the tile.
This will show you: 63c01b261c1e8Using the Application Usage and Application Timeline Together - Image 3.png
  • The name of each user
  • Total time they spent on the app 
  • How many times they opened it 
How to View Rarely Used Apps  Apps used for less than an hour are grouped together in the green tile called Less than 1 hour.  To view them:  63bd1b1a3314eApplication Usage Visualization - Image 4 gif_800px.gif
  • Click the green tile to expand it. 
  • Click the Applications button in the upper-right corner.
You’ll then see a list of all apps that fall under this category, including the total time spent and how many apps are grouped inside. Need More Options? Use the App Usage Menu You can take further actions on specific apps or users by using the App Usage Menu. It allows you to explore navigation options for each app or user. Learn more in our guide: How to Use the Application Usage Menu 
Copyright © 2025 Cloudica LLC