Keystrokes Timeline Guide
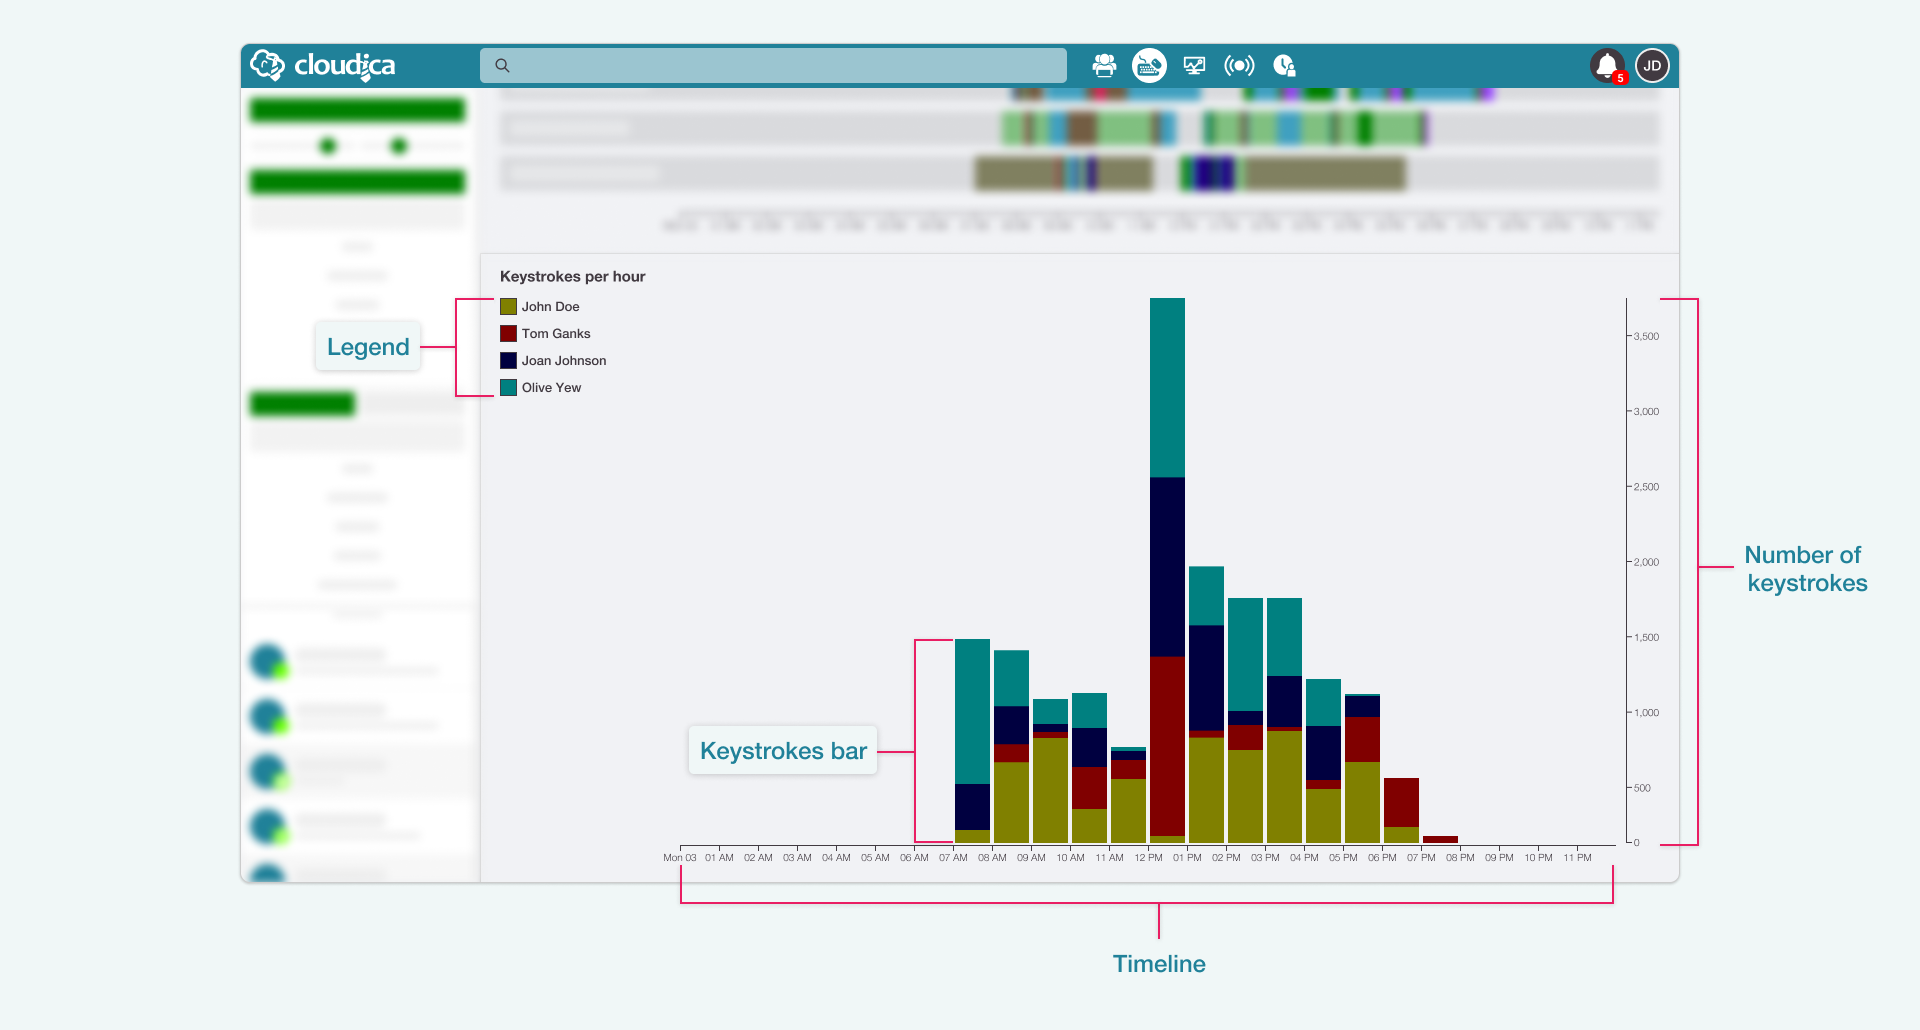
- Timeline A horizontal bar that spans 24 hours, broken down by the hour.
- Keystroke Count Axis The vertical scale shows the number of keystrokes made.
- Legend Shows a list of users, each with a unique color that corresponds to their activity in the graph.
- Keystrokes Bar Vertical colored bars represent each user's keystrokes per hour. The taller the bar, the more keystrokes during that hour. Multiple colors in one bar mean more than one user was active in that time slot.
- Hover over the legend This highlights that user's bars in the timeline and shows a tooltip with their total keystrokes for the day.
- Hover over the keystrokes bar This reveals detailed keystroke data for that specific hour.
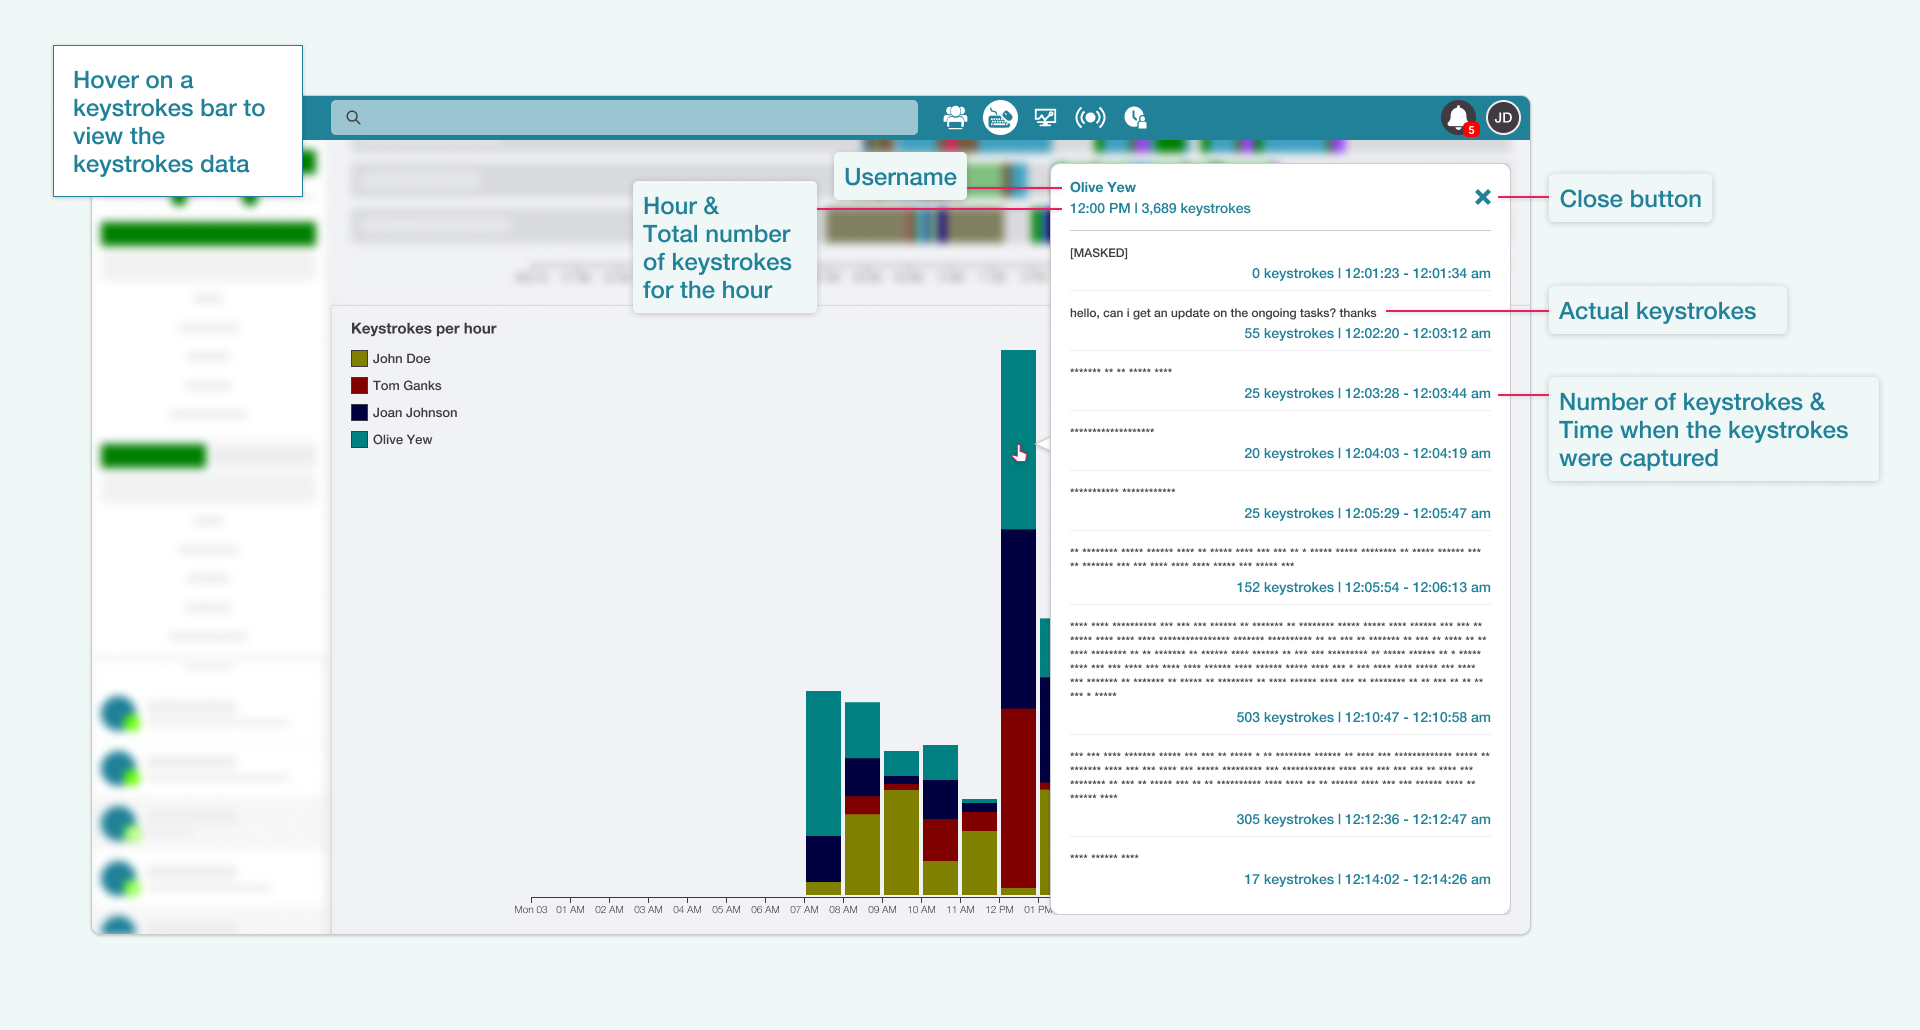
- Username The name of the user.
- Hour The specific hour the data was recorded.
- Total Keystrokes How many keystrokes were logged in that hour.
- Actual keystrokes A preview of what was typed during that time.
- Time When the typing activity occurred.
- Close button Click to close the popup when you're done.
- Spot active working hours
- Understand typing activity across the day
- Check productivity patterns without needing to read actual content
- Quickly assess which users are more engaged during specific time blocks