Remote User's Application Dashboard
The Application Dashboard is a remote user’s hub of all his/her captured data. It has four modules that present your data in ways that may enhance productivity, point out areas of improvement, and provide a visual presentation of your work progress.
A Remote User is a registered account user with no managerial role. Users with Manager roles have a different Application Dashboard with monitoring and productivity features to help evaluate and mentor users under them.
Components of the Application Dashboard
As a remote user, this quick guide will help you become familiar with the features and components you’ll find on the Application Dashboard, so you can use them where it is needed in your work dynamics.
Header
 The dashboard header consists of the:
- Cloudica™ logo Clicking the cloud or word logo will reset the Application Dashboard to the default view, which shows data of the current date and the Live Feed module.
- Status Message This allows you to post your Status Messages.
- NotificationsThis holds the latest and past notifications.
- User Menu This menu contains information about your account and other features, including Password Update, Logout, and Monitoring Status Update.
Below the header, there are two sections, User Information, and Navigation.
User Information
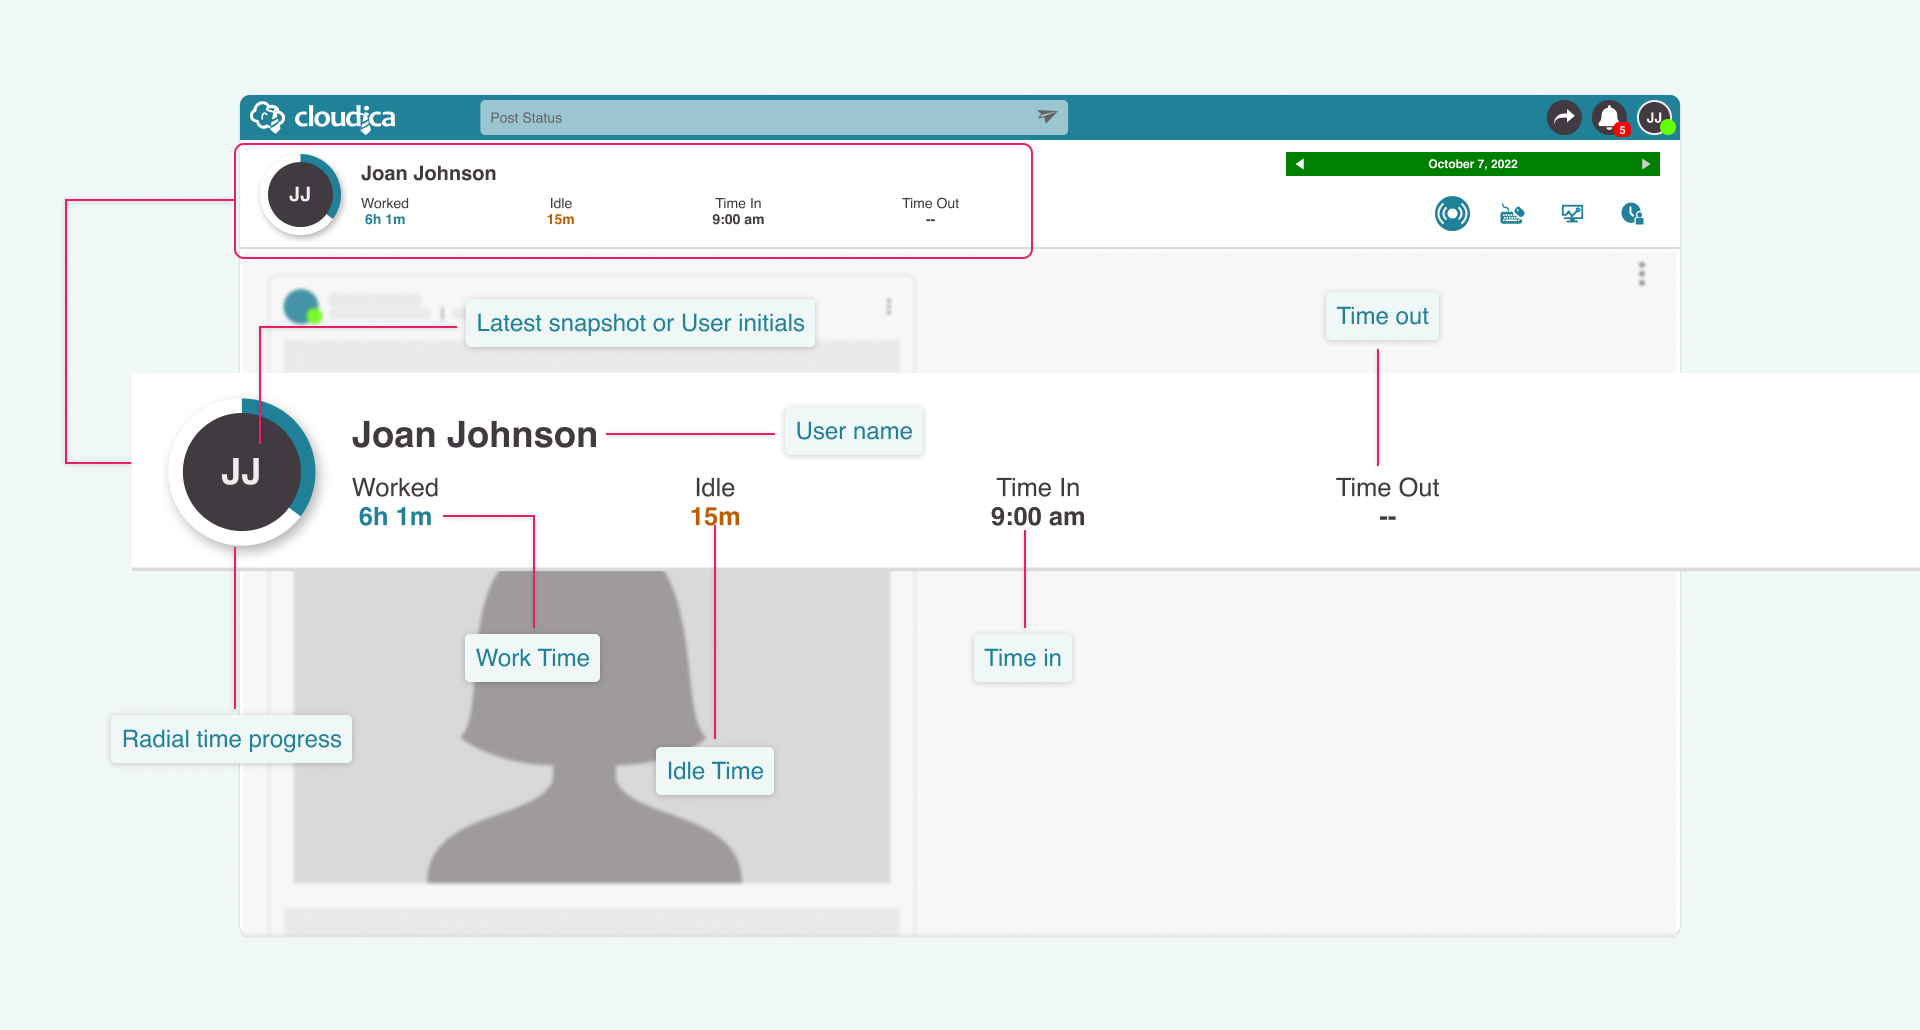 In the User Information part, the following details are displayed:
- Radial time progress
- Latest snapshot
- User name
- Work time
- Idle time
- Time in
- Time out
Navigation
On the right side of the header is the Navigation. This section helps you go to the different data modules of the dashboard and to past captured data.
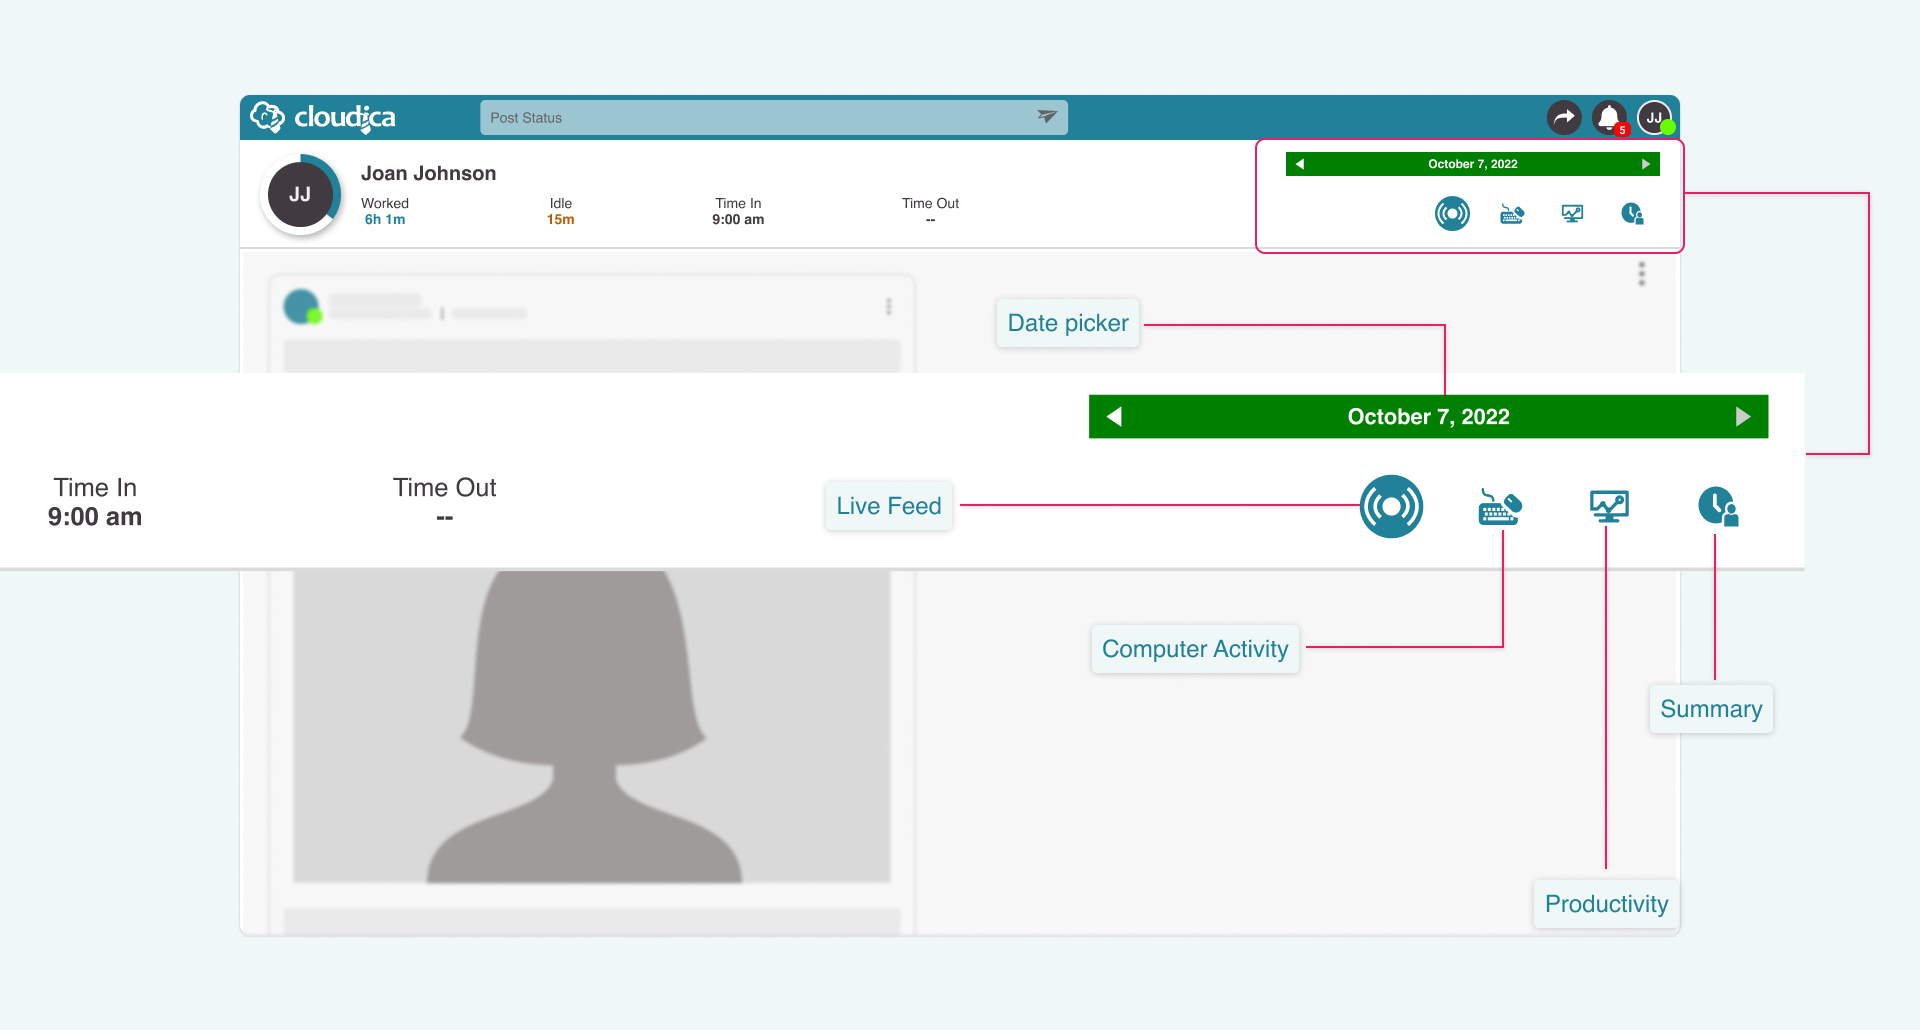 Parts of the Navigation
- Date picker
- Live Feed
- Computer Activity
- Productivity
- Summary
Date Picker
Your captured data is set to the current date by default. To check the data information from previous dates, you can use the Date Picker. You can access the data from three months back up to the current date.
 Learn more about how to use the Date Picker.
Live Feed
The Live Feed displays the real-time data captured by the Desktop Application. The dashboard will show the following data:
Learn more about how to use the Date Picker.
Live Feed
The Live Feed displays the real-time data captured by the Desktop Application. The dashboard will show the following data:
- Applications and Websites
- Screenshots
- Snapshots
- Keystrokes
- User Status
- Productivity Tagging
- Work Time logs
- Login
- Disconnection
- Status Messages
Read more about the Live Feed module.
Computer Activity
Computer Activity shows your captured data in maps and graphical illustrations. The captured application screenshots and keystrokes give you insights into how you’re doing your tasks and assignments, and how you use your time during your work hours. You’ll know how much time you spend on the applications and websites you use, and you can check your hourly keystrokes count too.
 Read more about the Computer Activity module.
Productivity
Productivity is the aggregated presentation of your data. The data are presented in easy-to-understand groups, charts, and timelines. It can be used to analyze work performance, workflows, and computer activities. Unlike the Live Feed, data in Productivity are not repeatedly displayed but instead are summarized and grouped.
Read more about the Computer Activity module.
Productivity
Productivity is the aggregated presentation of your data. The data are presented in easy-to-understand groups, charts, and timelines. It can be used to analyze work performance, workflows, and computer activities. Unlike the Live Feed, data in Productivity are not repeatedly displayed but instead are summarized and grouped.
 Read more about Productivity.
Summary
The Summary displays your data according to the recent Application screenshots, latest snapshots, Status Messages, and Latest Keystrokes. It gives a compact view of your data for the day.
Read more about Productivity.
Summary
The Summary displays your data according to the recent Application screenshots, latest snapshots, Status Messages, and Latest Keystrokes. It gives a compact view of your data for the day.
 Learn how to utilize the Daily Summary.
Copyright © 2025 Cloudica LLC